![]()
The Institute of Cosmos Sciences of the University of Barcelona (ICCUB) is an interdisciplinary centre devoted to fundamental research in the fields of cosmology, astrophysics and particle physics. ICCUB Technology Unit has a long track record in developing detectors based on Low Light Level photosensors for particle physics, astrophysics and medical imaging. This expertise includes photo-sensor simulation and characterization and front-end electronics development, including the design of Application Specific integrated Circuits (ASICs).
Simulation
Detector simulation using Monte Carlo tools as Geant-4, GATE or Penelope. Front-end electronics is designed and simulated with electrical simulators. We are working in integrating both simulation frameworks (detector and front-end), particularly to optimize timing systems based on fast scintillating crystals. GATE gives the possibility to tune the sensor in terms of sensor size, pixel pitch and dead area. The scintillator can be also modeled depending on light yield, decay times and surface roughness. Lastly, the electrical simulator is used to model the sensor and the front-end in order to optimize the readout circuit in terms of the input impedance, noise, bandwidth and signal processing.
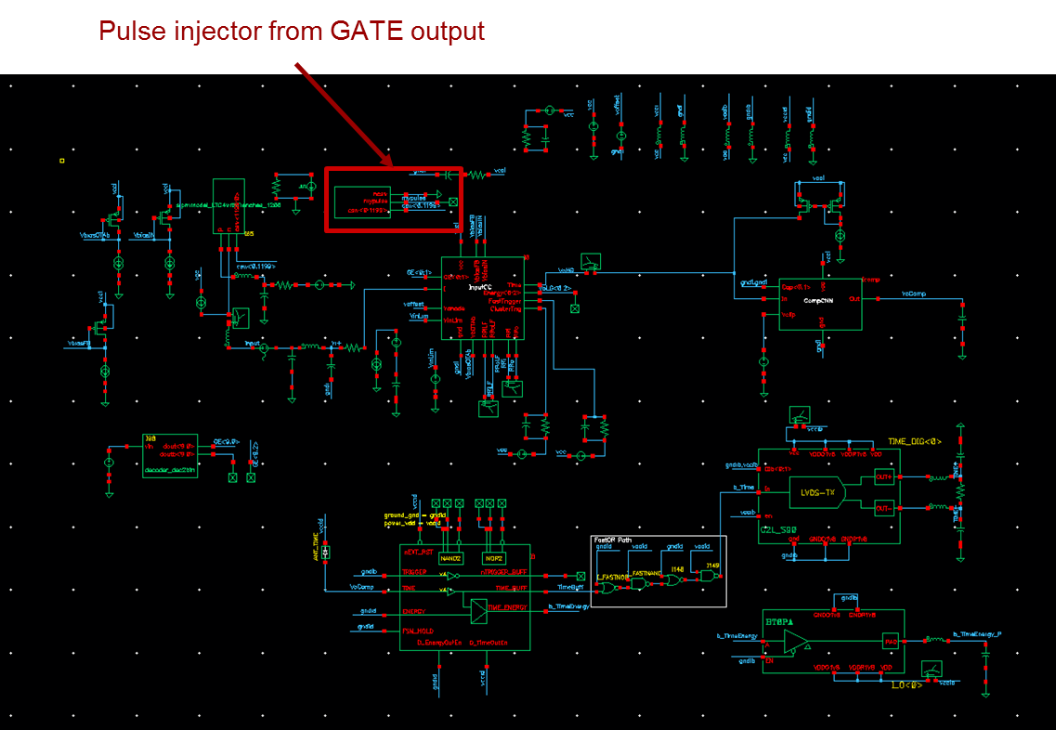
Electrical simulator schematic. It highlights the module used to fire the MPPC signal following the delay distribution from GATE.
Electro-optical characterization
Different set-ups are used to characterize and obtain the electrical model of a SiPM:
A Keithley 2612 source-meter analyser is used to obtain the I-V curves, and thus compute the breakdown voltage, the Cq+Cd capacitance and the quenching resistance.
A network analyser (Rohde & Swartz ZVL3 ,9kHz to 3GHz) and time domain analysis is used to compute additional capacitances and parasitic elements of the model. The time domain analysis is based on PACTA preamplifier ASIC plus a high sampling rate digital oscilloscope (Agilent MSO9404A 4Ch + 16D 4GHz 20GS/s). A detailed electrical mode model of PACTA (developed by ICCUB) allows to compare simulation and measurement results in order to tune the free parameters of the SiPM model.
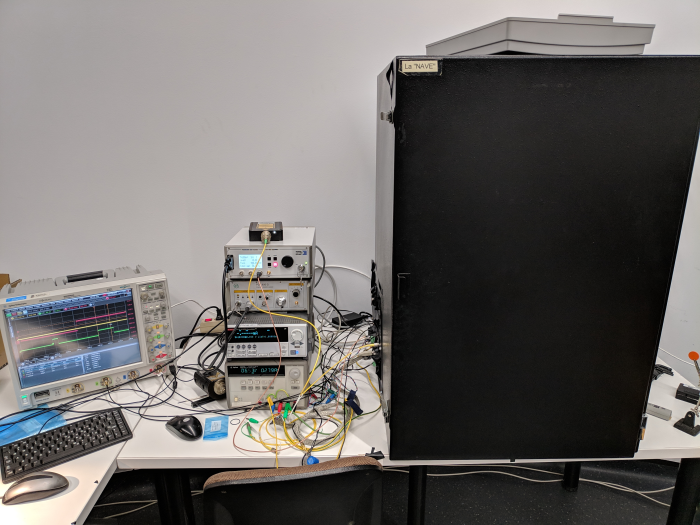
Experimental set upfor SiPM characterization including: (left) Oscilloscope; (center from top to bottom) laser from Pilas, laser driver from Pilas, laser driver from Picoquant, High Volage power supply and low voltage power supply; (right) black box for electronics.
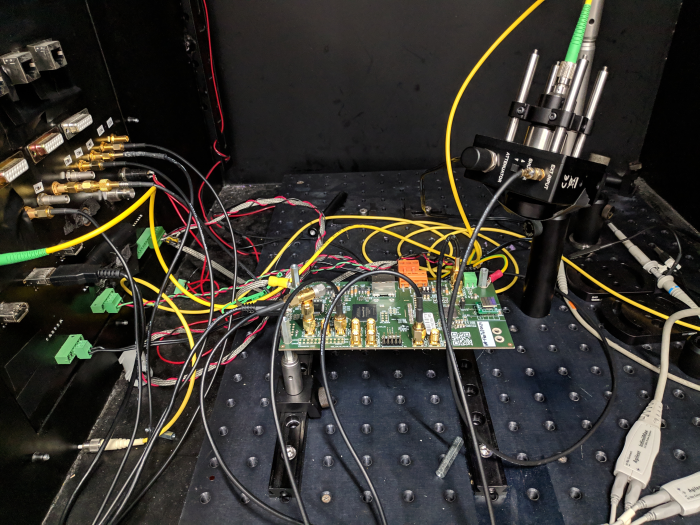
Electronics (HRFlexToT ASIC) used for SiPM characterization inside the black box.
PACTA preamplifier1.
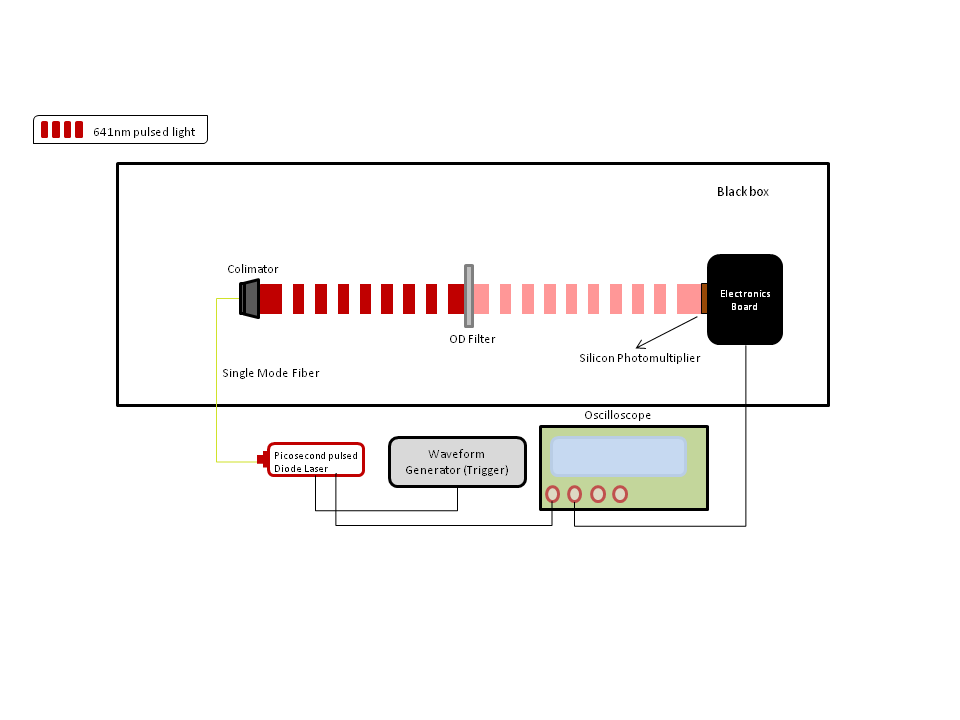
Schmatic of the setup used for SPTR measurements
Single photon time resolution (SPTR) measurement set-up consists of different elements, as shown above. First, an external trigger at 50kHz sends a signal to both the laser driver and the oscilloscope. Second, the laser driver sends a pulse to the laser. Different picosecond lasers are used: PicoQuant LDH at 641nm (50ps pulse width) and a 20ps jitter diode laser driver (PDL 800-D), Picosecond laser diode system “PiLas” at 405nm (45ps pulse width) and a PiLas digital control unit with 4ps jitter (EIG2000DX). The laser generates a photon package that passes through an optical attenuator and diffuser, which increases the light homogeneity that reaches the MPPC. Thirdly, temperature is stabilized around 18 degrees Celsius to avoid gain variations and diminish dark count noise. Lastly, the MPPC signal is processed with different front-end system (as MUSIC2 or HRFlexToT3 ASICs) and acquired with a fast DSO Agilent MSO9404A 4Ch + 16D 4GHz 20GS/s) or an analog waveform sampler (Wavecatcher, 12-bit @ 3,2 GS/s).
Example of experimental results
Dark Count Rate (DCR) measurements. The DCR of an MPPC is analyzed using either the MUSIC or HRFlexToT ASIC which enables to count the number of dark count events. Basically, these ASICs converts the analog input signal of an MPPC into a binary signal by using a leading-edge comparator controlled by a voltage threshold reference. The optimum threshold to detect the first photons is determined by performing DCR measurements for different thresholds values. Measurements were performed in a black box with temperature stabilized at 15➦Celsius. Observe that, only pulses generated by the intrinsic self-triggered avalanches, i.e, the dark counts, are acquired. Belwo the typical staircase plot for different over-voltages is shown. The optimal threshold to perform SPTR measurements can be found in the first plateau.
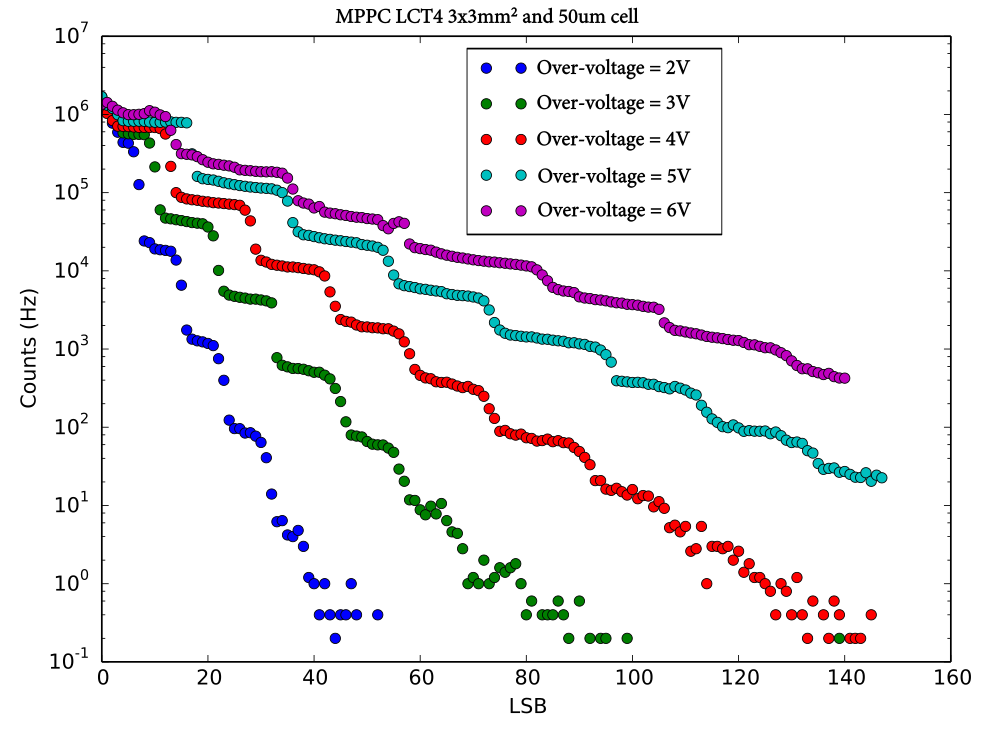
Staircase plot, DCR at different over-voltages.
Below is the analogue signal of a 3x3mm2 and 75µm pixel pitch MPPC LCT4 used to calculate the charge collected by the photoelectrons and also a basic SPTR measurements of the time response of the MPPC when using a comparator to obtain the arrival time of the photons. Time response of the front-end ASIC (HRFlexToT) is evaluated by obtaining the time delay between the falling edge of the trigger and the rising edge of the time signal.
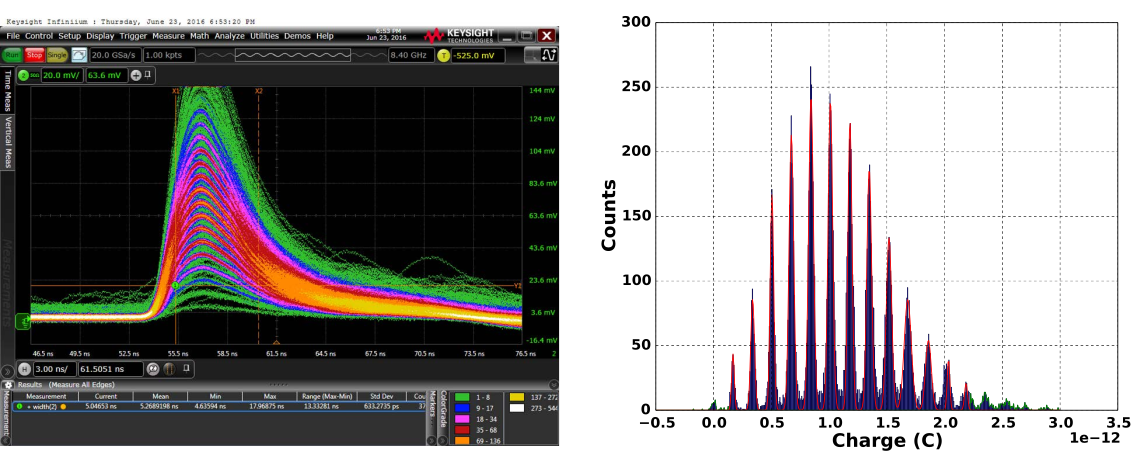
Typical analog pulse of an MPPC (3x3mm2 and 75µm pixel pitch MPPC LCT4).
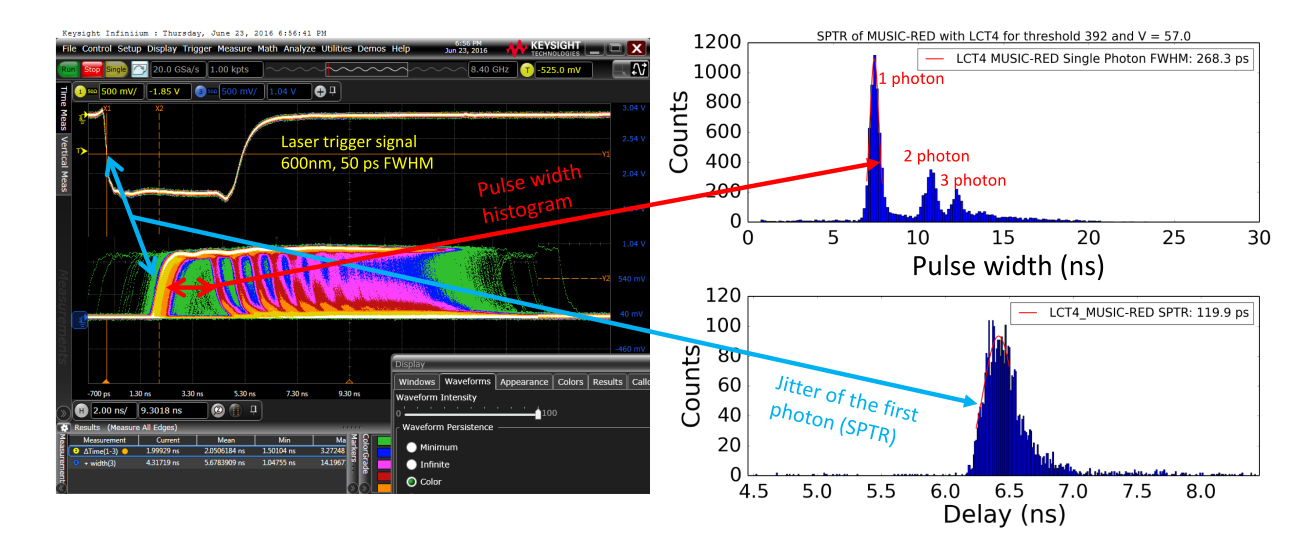
SPTR measurements between the trigger signal and the arrival time of the events for a 3x3mm2 and 75µm pixel pitch MPPC LCT
The delay time, width of the time signal and charge of the analog signal are shwon below. All images clearly show the peaks of the first, second and even the third photo-electron. A time walk effect can be seen in the left and middle plot. The right plot shows the non-linear ToT behavior for the time signal. Observe that the distance between peaks is linear in terms of charge, but not for the time width (non-linear correlation trend) as expected.
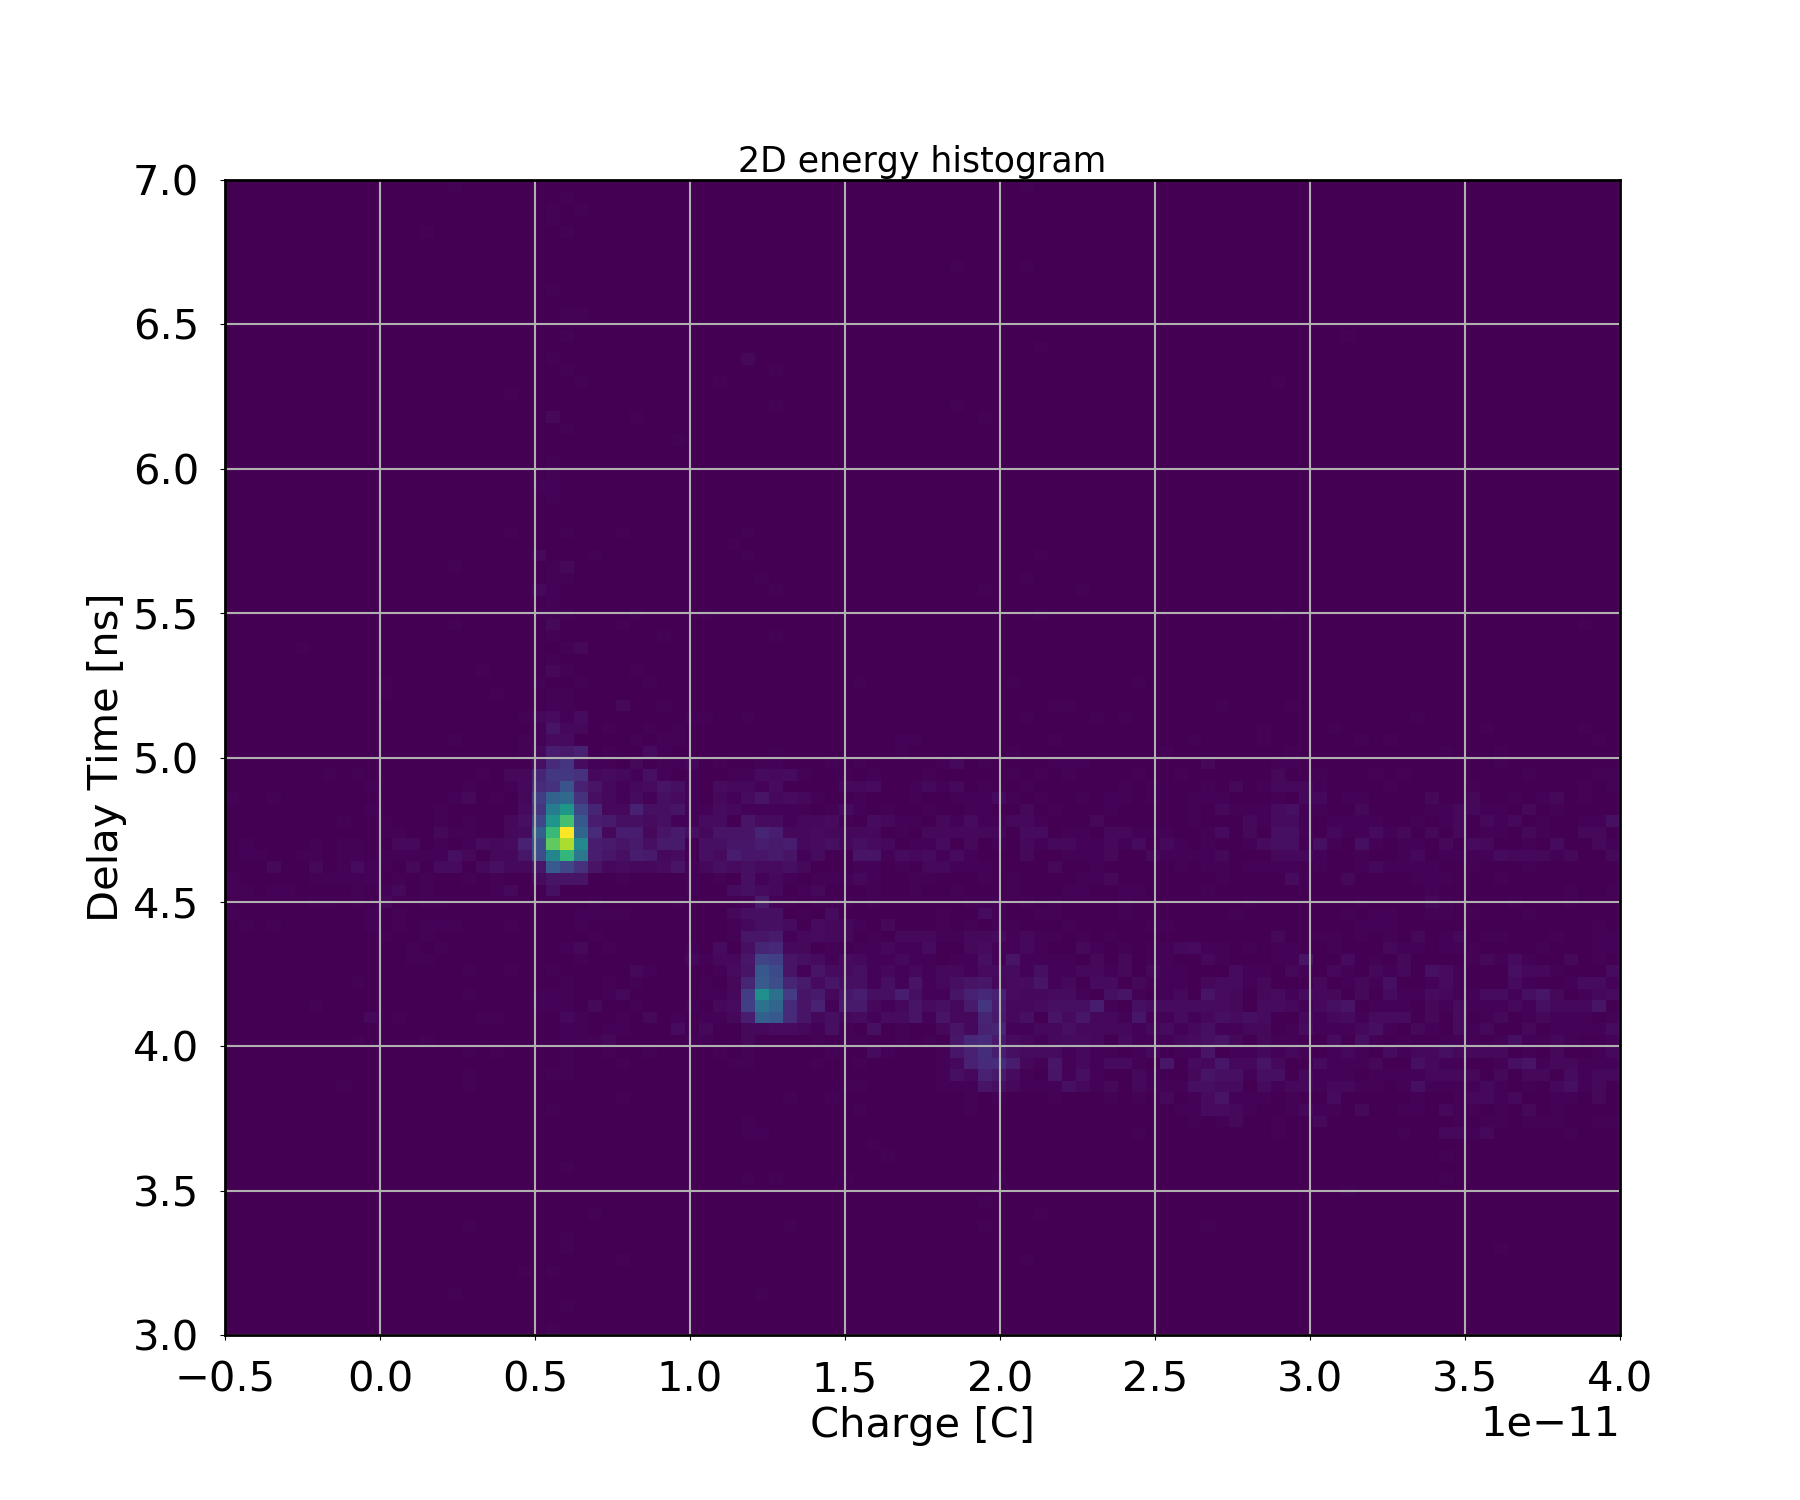
Correlation between the delay time (trigger - time signal) and the charge
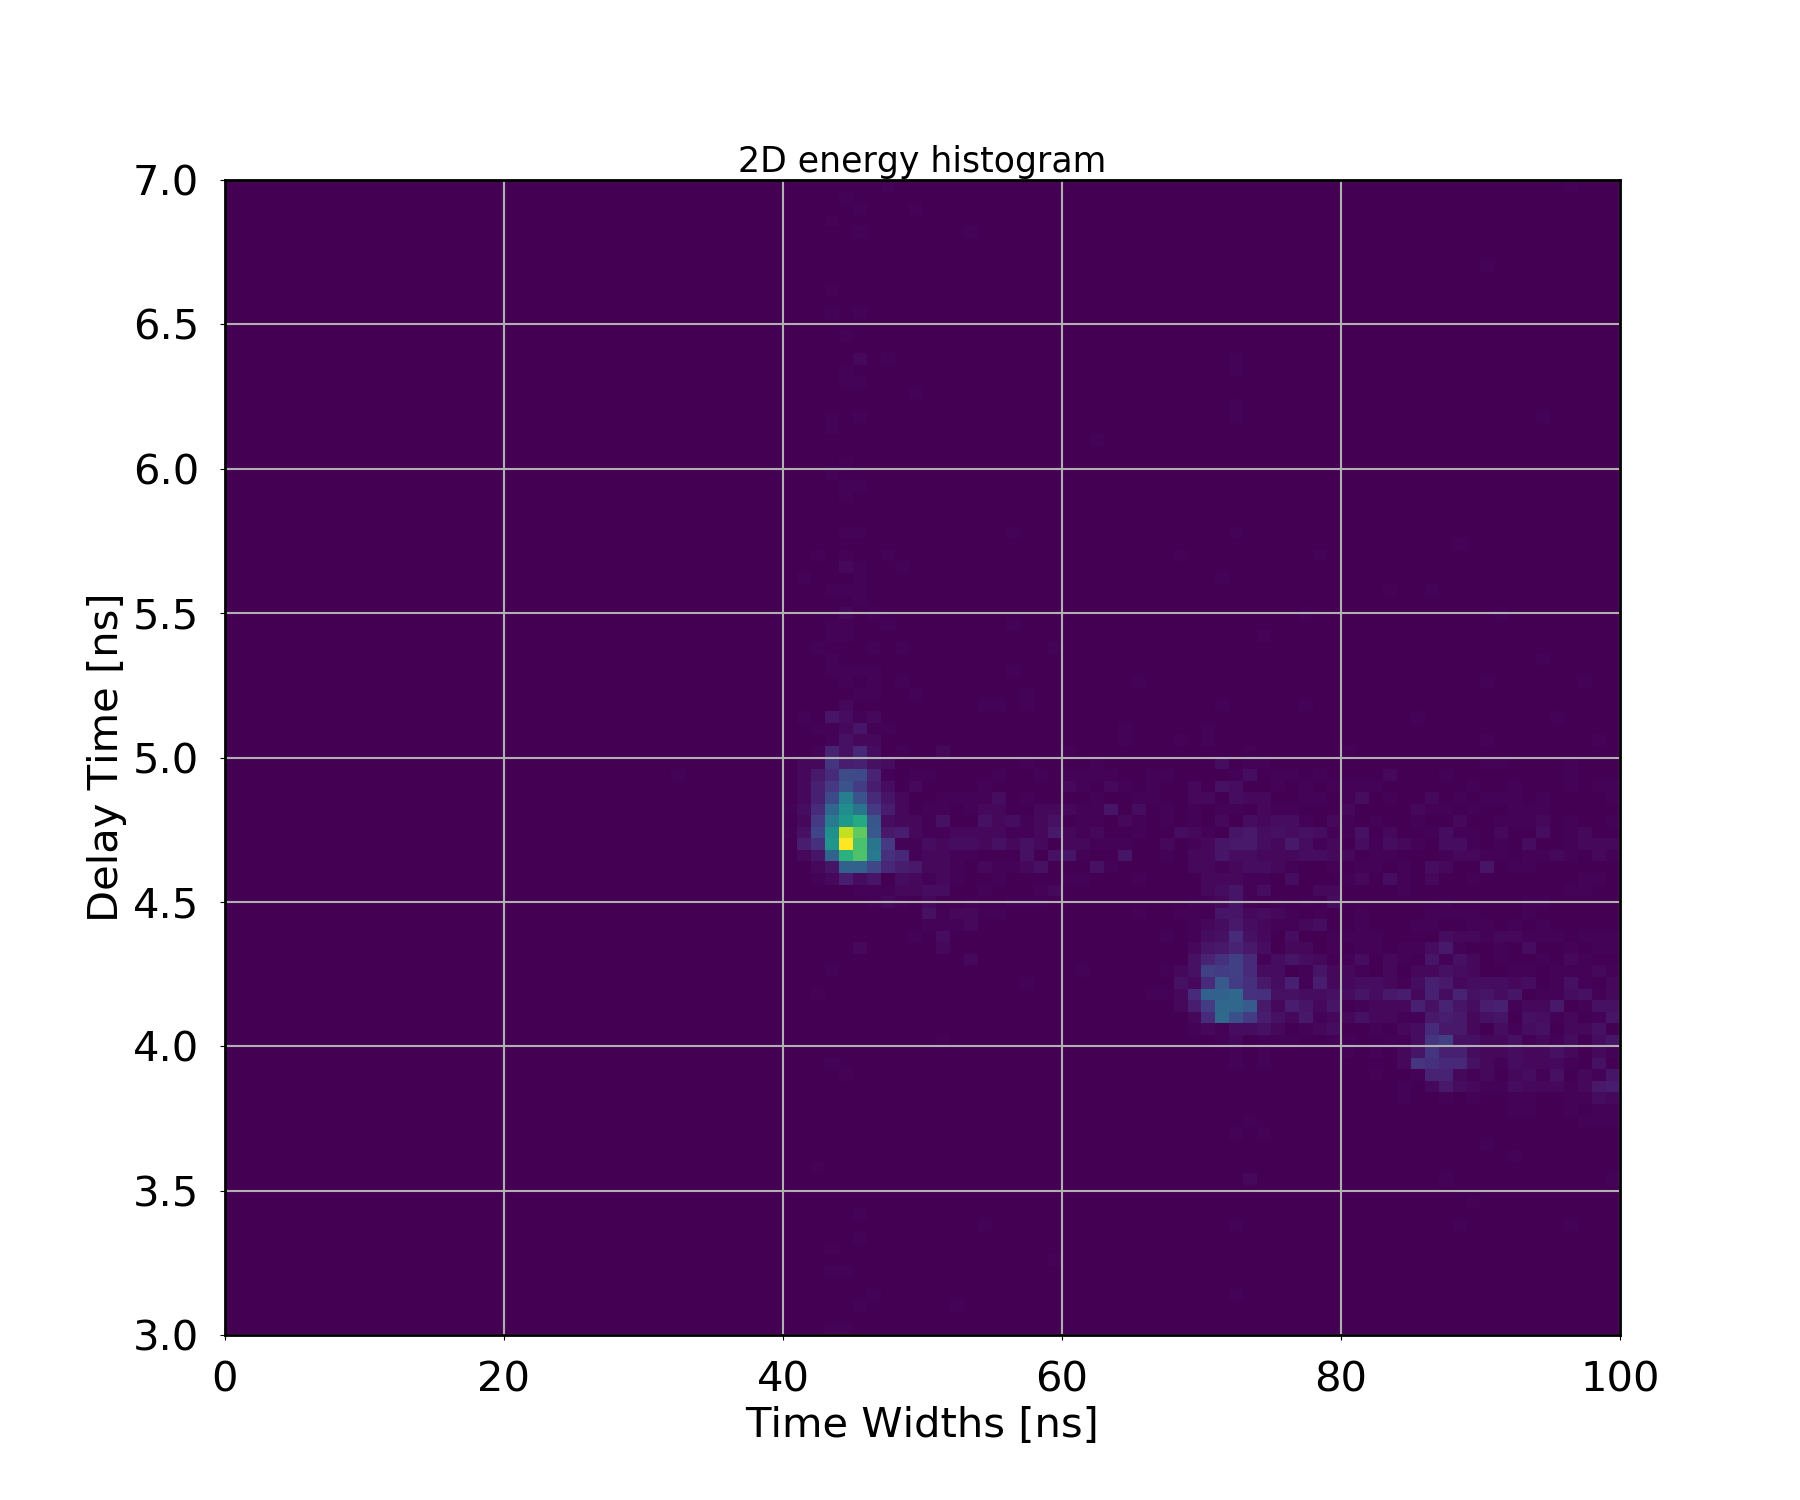
Correlation between the delay time (trigger - time signal) and width of the time signal
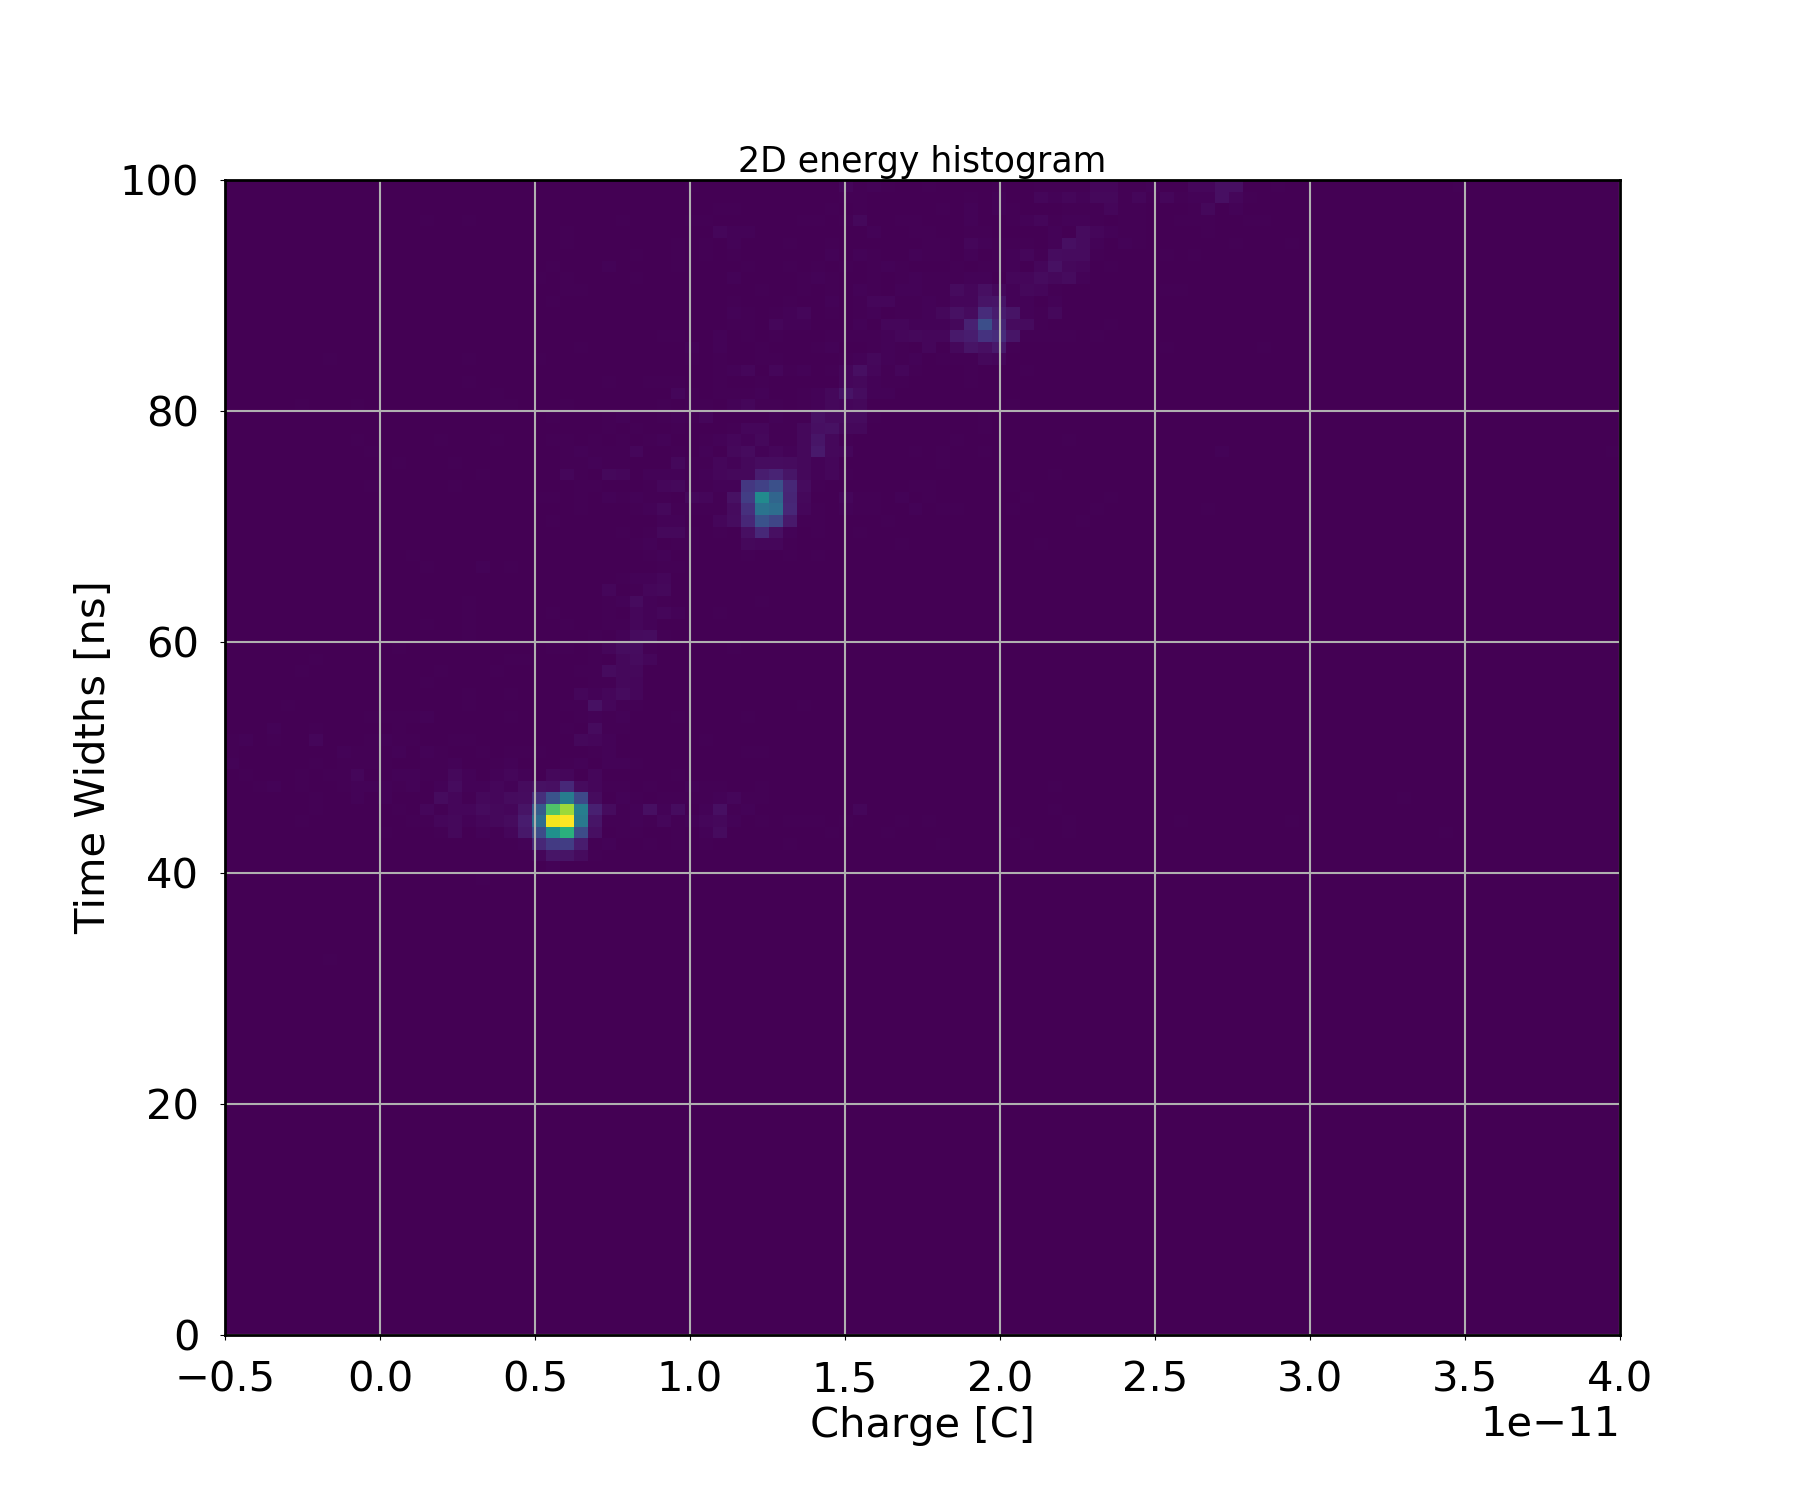
Correlation between the width of the time signal and the charge.
The next plot shows the charge histogram for different photons and the delay distribution of the single photon detection. Notice that the zero charge peak correspond to the events where no photon is detected, the next peak coincide with the charge of one photon and generally peak number i + 1 corresponds to photon i. The standard deviation of the delay, i.e., the jitter corresponding to the single events is known as the Single Photon Time Resolution (SPTR). Each peak is fi following a Gaussian approximation, where the sigma value of this Gaussian corresponds to the SPTR in sigma.
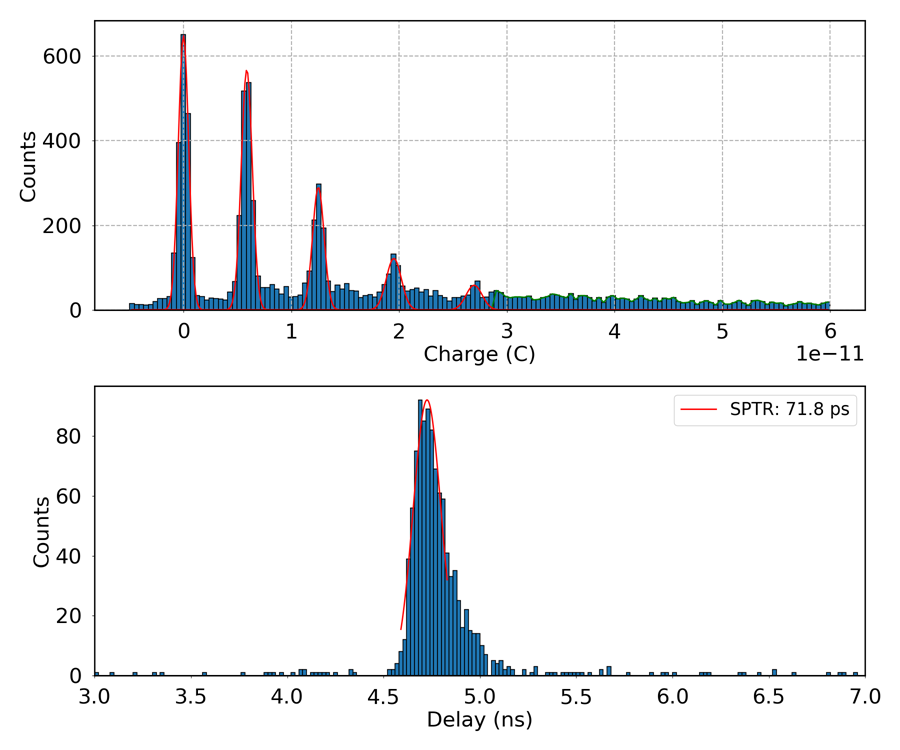
(Top): charge distribution for low light laser intensity;
(Bottom): delay time distribution for single photon events. Sensor used: LCT4 of 3x3mm2 and 75µm of pixel pitch, bias voltage of 59V (over-voltage around 7V).
Energy and Coincidence Time Resolution (CTR) are performed as well using radioactive sources, see figures below.
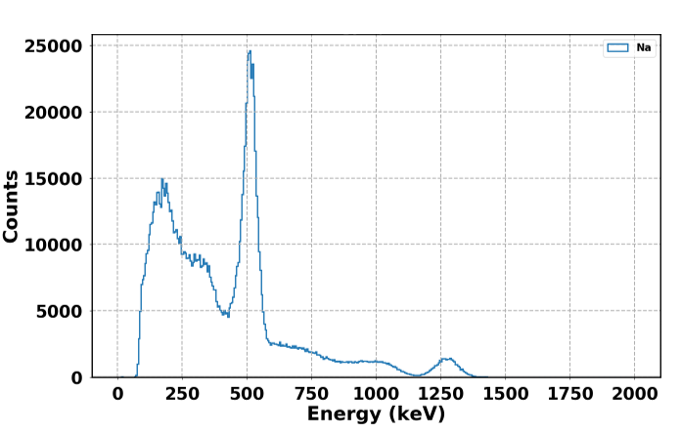
Energy spectrum for Na-22 source.
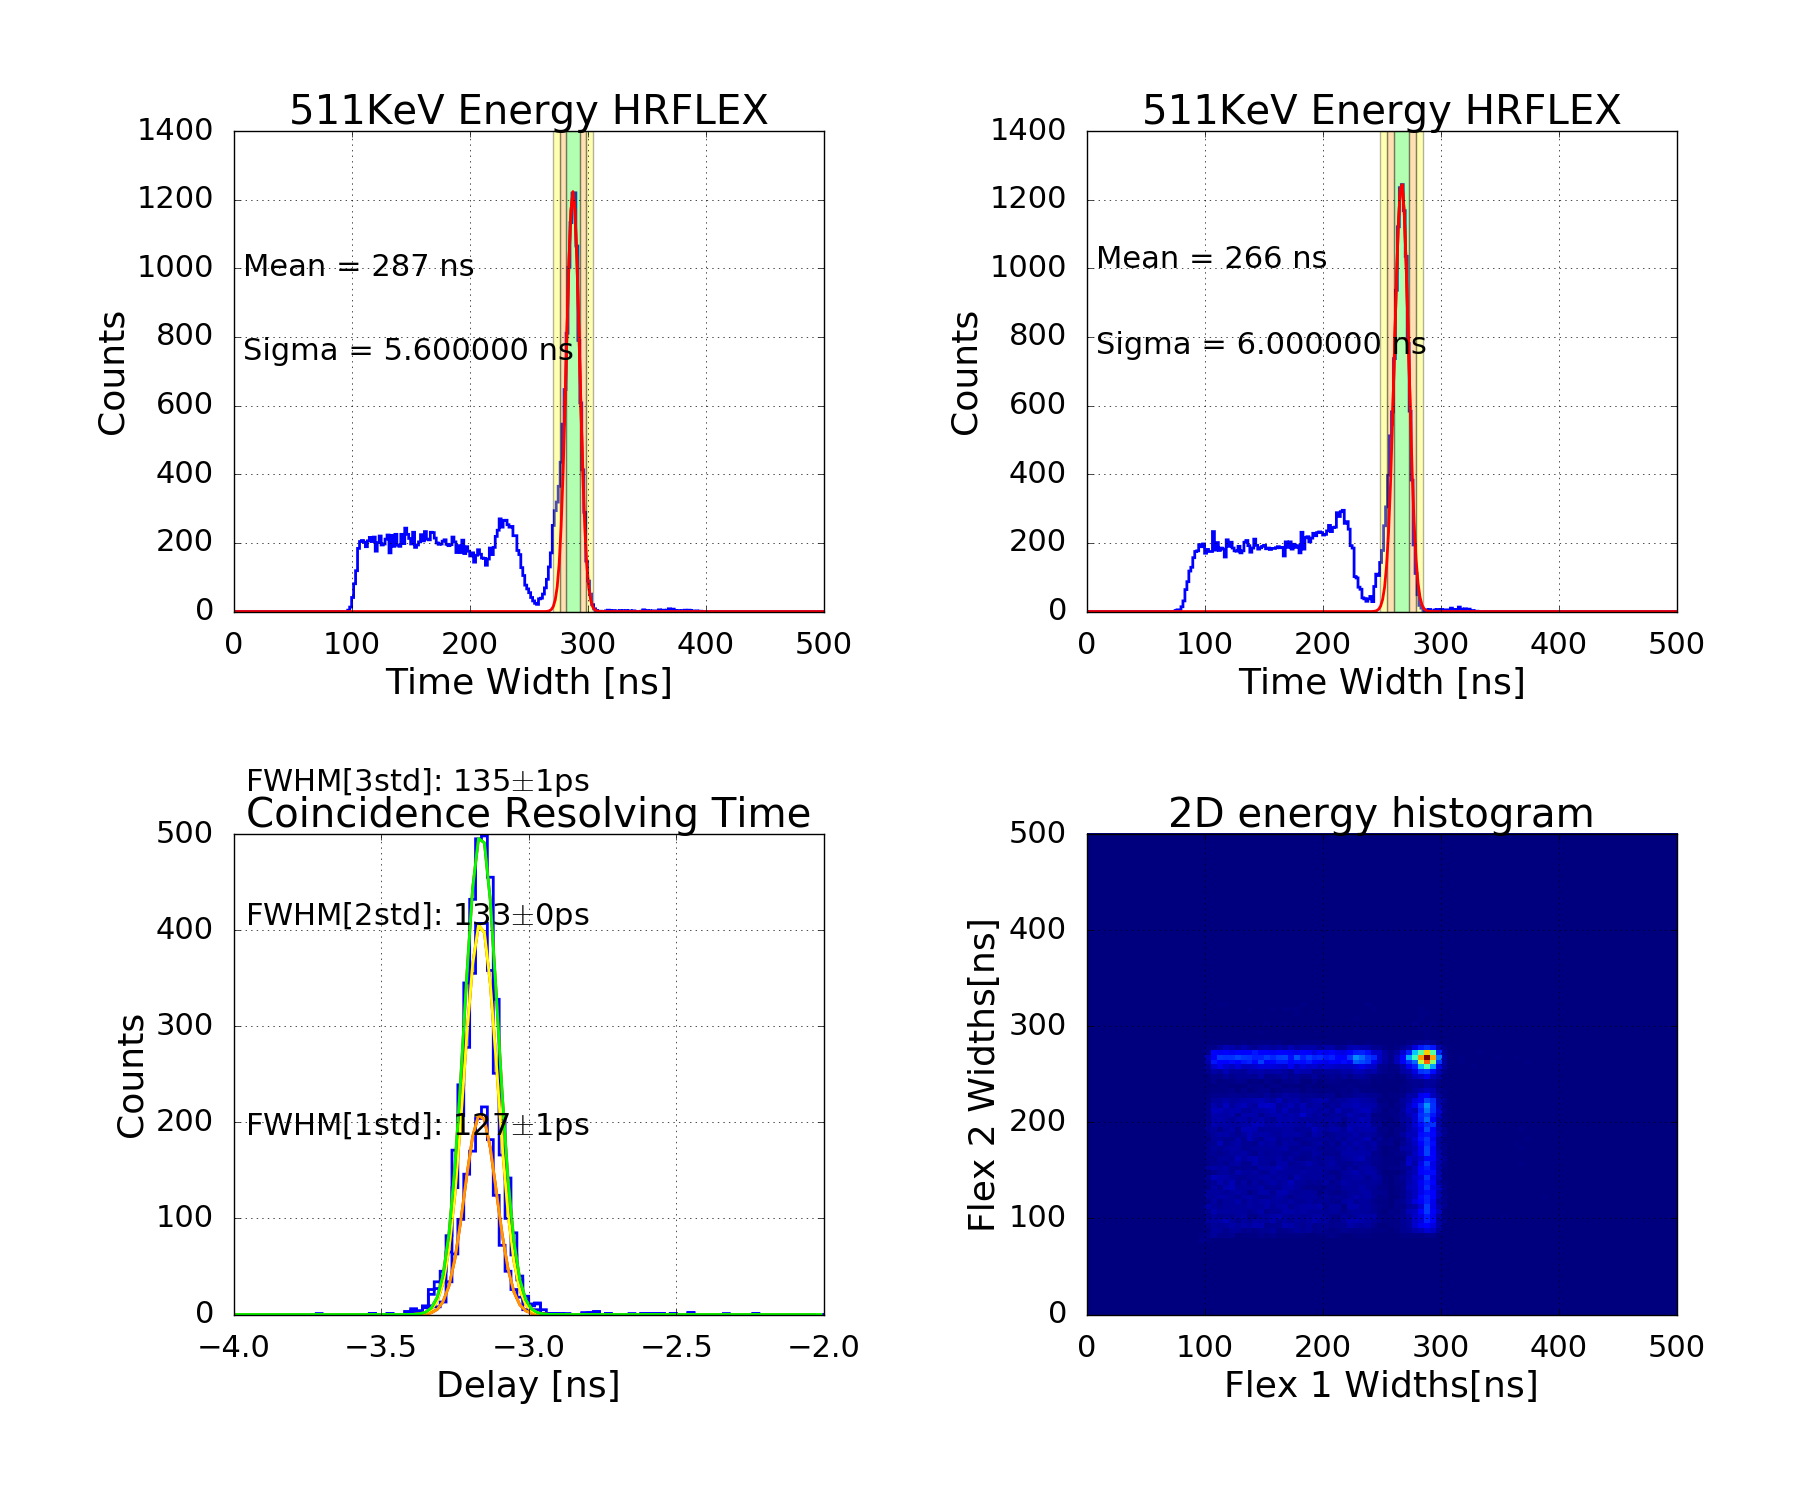
Coincidence Time Resolution (CTR) between two MPPCs: (LCT5 of 3x3mm2 and 50µm of pixel pitch) using a scintillator crystal of 2x2x5mm3 LSO:Ce Ca 0.4%.
CTR measurements are performed by confronting two SiPMs with a scintillator crystal and a sodium radiation source between them. Each SiPM is connected to a different acquisition board with an SiPM in each of them. Then, the CTR is obtained by computing the average delay between the coincidence detected events between both boards.
Contact
This email address is being protected from spambots. You need JavaScript enabled to view it., This email address is being protected from spambots. You need JavaScript enabled to view it., This email address is being protected from spambots. You need JavaScript enabled to view it.
Universitat de Barcelona
Institut de Ciències del Cosmos
1) Wideband (500 MHz) 16 bit dynamic range current mode PreAmplifier for the CTA cameras (PACTA), A Sanuy, D Gascon, J M Paredes, L Garrido, M Ribó and J Sieiro, January 2012 • Journal of Instrumentation, Volume 7, January 2012
2) Gómez, S.; Gascón, D.; Fernández, G.; Sanuy, A.; Mauricio, J.; Graciani, R.; Sanchez, D. MUSIC: an 8 channel readout ASIC for SiPM arrays. Proceedings Volume 9899 of SPIE Photonics Europe, Optical Sensing and Detection IV; Brussels, 2016
3) D. Gascon, S. Gomez, R. Manera, J. Mauricio, D. Sanchez, et al. "A high dynamic range ASIC for time of flight PET with monolithic crystals" TWEPP 2018 Topical Workshop on Electronics for Particle Physics, 2018, Antwerp, Belgium.