 At the Nagoya University an experimental setup for the characterization of SiPMs is available using a calibrated SiPM as reference to obtain photon detection efficiencies. A climate chamber provides constant room temperature and eight pulsed LED light sources are available.
Below the experimental setup to characterize SiPMs at Nagoya University is shown. We do not use a calibrated photo diode for absolute measurements of the photon detection efficiencies since it requires relatively intense light compared with SiPMs, which introduce complexities and additional systematics in the measurements. Since we need to calibrate large variety of SiPMs, we would like to have a simple setup that is sufficient for our purpose. For this reason, we use a calibrated SiPM to obtain photon detection efficiencies. In our set up, the light output is always monitored by the monitor SiPM. The Monitor SiPM does not have to be calibrated since it is just used to compensate the changes in the light output.
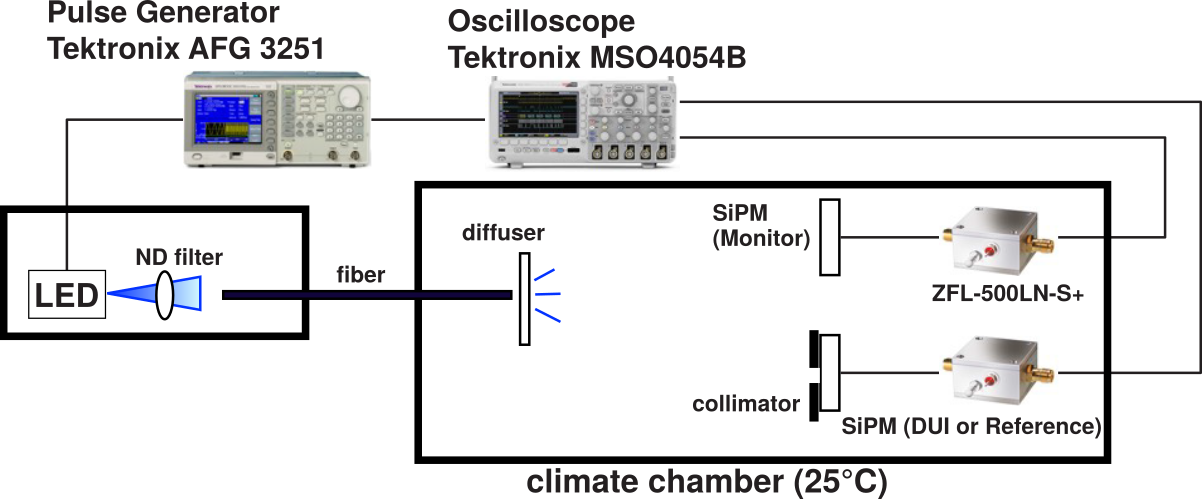
Schematic view of the experimental setup at Nagoya University
In order to measure the photon detection efficiencies, the average number of photoelectrons (p.e.) per pulse is measured by the device under investigation (DUI) and the calibrated SiPM at the same location. Both SiPMs (DUI and monitor) are placed inside the climate chamber so that we can control the temperature. The light source is outside of the climate chamber so that the light output does not depend on the temperature of the DUI. The light pulse is produced by the Tektronix AFG 3251 function generator, with a pulse width of 8 ns and a repetition rate of 2MHz. The light intensity is adjusted by a neutral density filter instead of adjusting the amplitude of the voltage pulse applied to the LED since LEDs require certain voltage amplitude to operate stably. The light is transported by a fiber from the outside of the climate chamber into the inside. The light output from the fiber is spread by a diffuser so that the monitor SiPM can monitor the light output nearby the DUI. The location of the monitor SiPM is fixed to ensure a stable monitoring of the light output. Our measurement is not very sensitive to the location of the DUI since we have a collimator in front of the DUI. However, the DUI must be placed as close to the collimator as possible to ensure all the light that pass through the collimator impinge on the DUI.
Waveform processing
The SiPM output is amplified by the Mini-circuit ZFL-500LN-S+ which has a 500 MHz bandwidth. The waveform of the amplifier output is recorded by the oscilloscope, Tektronix MSO4054B, continuously for 100 µs at 2.5 GS/s sampling rate with a bandwidth of 500 MHz. Since the raw waveform has a high frequency noise peaking at 400 MHz, the frequency above 400 MHz is completely cut off in the frequency domain. In order to cut the long tail of the SiPM output, pseudo pole-zero cancellation is applied digitally. The figure below shows a sample of waveforms where the black curve shows a waveform after high frequency noise was cut off and the green curve show a waveform after the pseudo pole-zero cancellation. Peak finding is performed by a 11.6-ns sliding window. Once the peak is found within a window, the baseline is defined as a minimum value within 11.6 ns before the peak. The pulse height of the peak is calculated as the difference between the peak and the baseline. The next peak search starts from 5.8 ns after the peak.
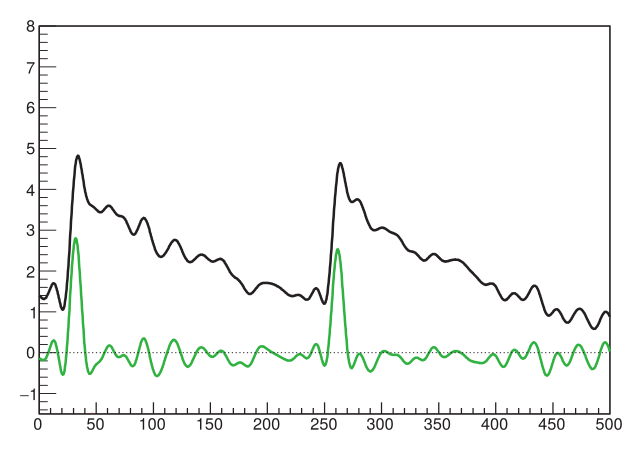
Sample waveforms. The black curve shows a waveform after high frequency noise was cut off and the green curve show a waveform after the pseudo pole-zero cancellation
Photon Detection Efficiency Measurement
The average number of p.e. during the pulse period is calculated from a Poisson probability of observing no photon signal above a certain threshold. The threshold is typically 3.3 sigma below the one p.e. peak. But the threshold has to be between 0.55 p.e. and 0.66 p.e. We primarily take 3.3 sigma within one p.e. as one p.e. since those events outside of this region is caused by after pulses or overlapping pulses, not pure single p.e. pulses. In order to account for the effect of the dark count during the pulse period, we also measure the zero photon probability during the no pulse period and make correction as,
P(0) = PON(0) / POFF(0),
⟨Np.e.⟩= –ln[P(0)],
where P(n) is a Poisson probability of observing n p.e. As described above, we do not use a calibrated photo diode. Instead, we monitor the light output by a concurrent measurement by a monitor SiPM. We compensate for any change in the light output by taking the ratio of the average number of p.e. as,
R = ⟨Np.e.⟩DUI/⟨Np.e.⟩MON
Because of this scheme, R is very stable within one percent while ⟨Np.e.⟩MON varied by up to 10% as shown below:
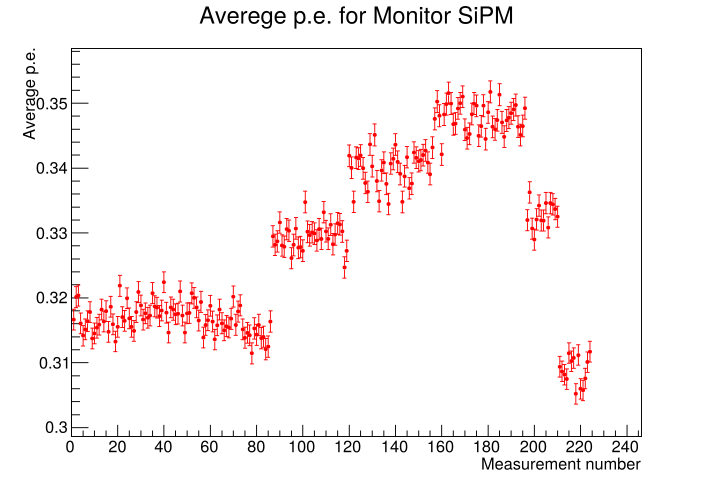
Variation of the average number of p.e. measured by the monitor SiPM. The horizontal axis is the measurement number and spans more than one month.
The absolute value of the photon detection efficiency is calculated using the ratio as,
PDEDUI = PDEREFxRDUI/RREF
Note that the bias voltage for the reference and monitor SiPM is fixed at the region where the photon detection efficiency is saturated so that the temperature variation does not affect the measurements. (In addition, the gain of the SiPM is also monitored to verify the stability of the over voltage.)
Optical Cross Talk Measurement
The optical cross talk rate is calculated, in principle, from the ratio of the number of events for 2 p.e. or more with respect to the number of events for one p.e. or more during the no light pulse period since those events are caused by single p.e. dark count. However, some events for 2 p.e. or more may be caused by overlap of two or more independent dark counts if waveform analysis cannot separate them. Since we cannot recognize any two pulses within 5.8 ns, they may be recognized as single 2 p.e. pulse. Taking into account such effect, we calculate the optical crosstalk rate, ROCT as,
ROCT = 1−[1−N<(≧2 p.e.)/N(≧1 p.e.)]/exp(−fDCRΔtPS),
where fDCR is the dark count frequency and ΔtPS is the minimum time required to separate two independent pulses and is assumed to be 5.8 ns in our analysis. N(≧1 p.e.) is defined as the number of events above 3.3 sigma below 1 p.e. (the threshold has to be between 0.55 p.e. and 0.66 p.e.) while N(≧2 p.e.) is defined as the number of events above 3.3 sigma above 1 p.e. (the threshold has to be between 1.34 p.e. and 1.45 p.e.).
Example of experimental results
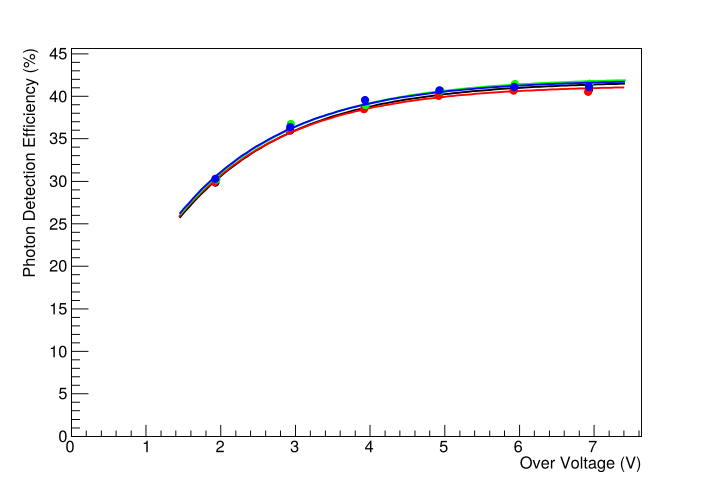
The figure below shows the absolute PDE as a function of the over voltage for Hamamatsu S14520-6050VS measured four times over one month period. The fit yields maximum PDE of 41.8% with an RMS of 0.4%.
Contact
Nagoya University
Institute for Space-Earth Environmental Research Center for Orbital and Suborbital Research
tajima<at>isee.nagoya-u.ac.jp
Phone: +81-52-789-4314